3D INTERACTIVE
In these pages we provide the results of a representation system for molecules, based on the code developed in BioBlender, as an application of SpiderGL, described in Callieri et al., called SpiderMol. While this visualization does not permit molecular animation, it offers the possibility of direct user interaction: use your Left Mouse Button to rotate the molecule(s), the wheel to zoom in and out and the commands at the bottom to change the view (add/remove EP line particles; toggle stereo view as side- by-side or anaglyph; see underlying atoms through a lens or in the entire molecule). For the side-by-side view, the user can modify the distance between the 2 views using the keyboard: a to increase and z to decrease.
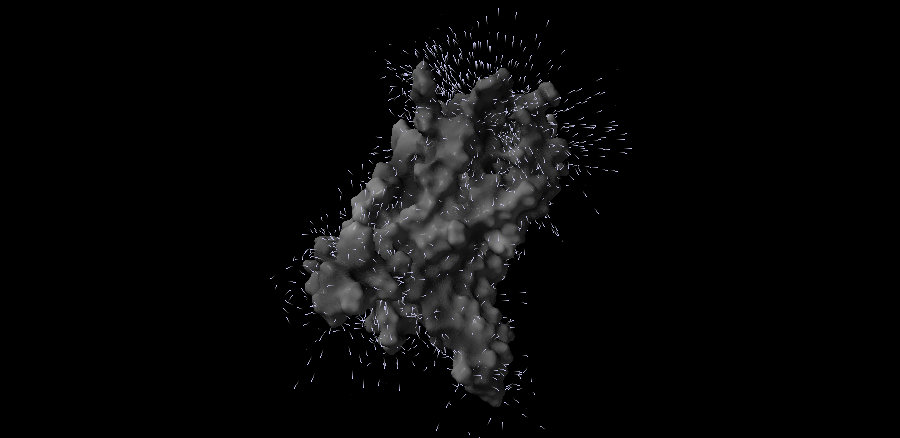
Surface texture represents the MLP (lipophilic potential) calculated using an atom-based formula (Testa) as described in Andrei et al.. Values are converted to scale of shine/smooth (very hydrophobic) to dull/rough (very hydrophilic). Electrostatic Potential (EP) is calculated in the space of the protein(s) using APBS, converted to vector grid, and the grid is used for drawing EP lines, in proportion to the local charge at the protein surface. Particles travel along the lines in the direction positive to negative charge.
© 2013